

Analytics and Automation: Do something useful with your data
Luminous pulls all your data into a centralized hub, which is fantastic. However, it’s what it empowers you to do with data that makes it game-changing. Luminous is packed with custom analytics, reporting, and automation tools that allow you to watch over every important metric in real-time—and make the best and most informed decisions to fuel your growth.
TRUSTED BY hundreds of LEADING BRANDS


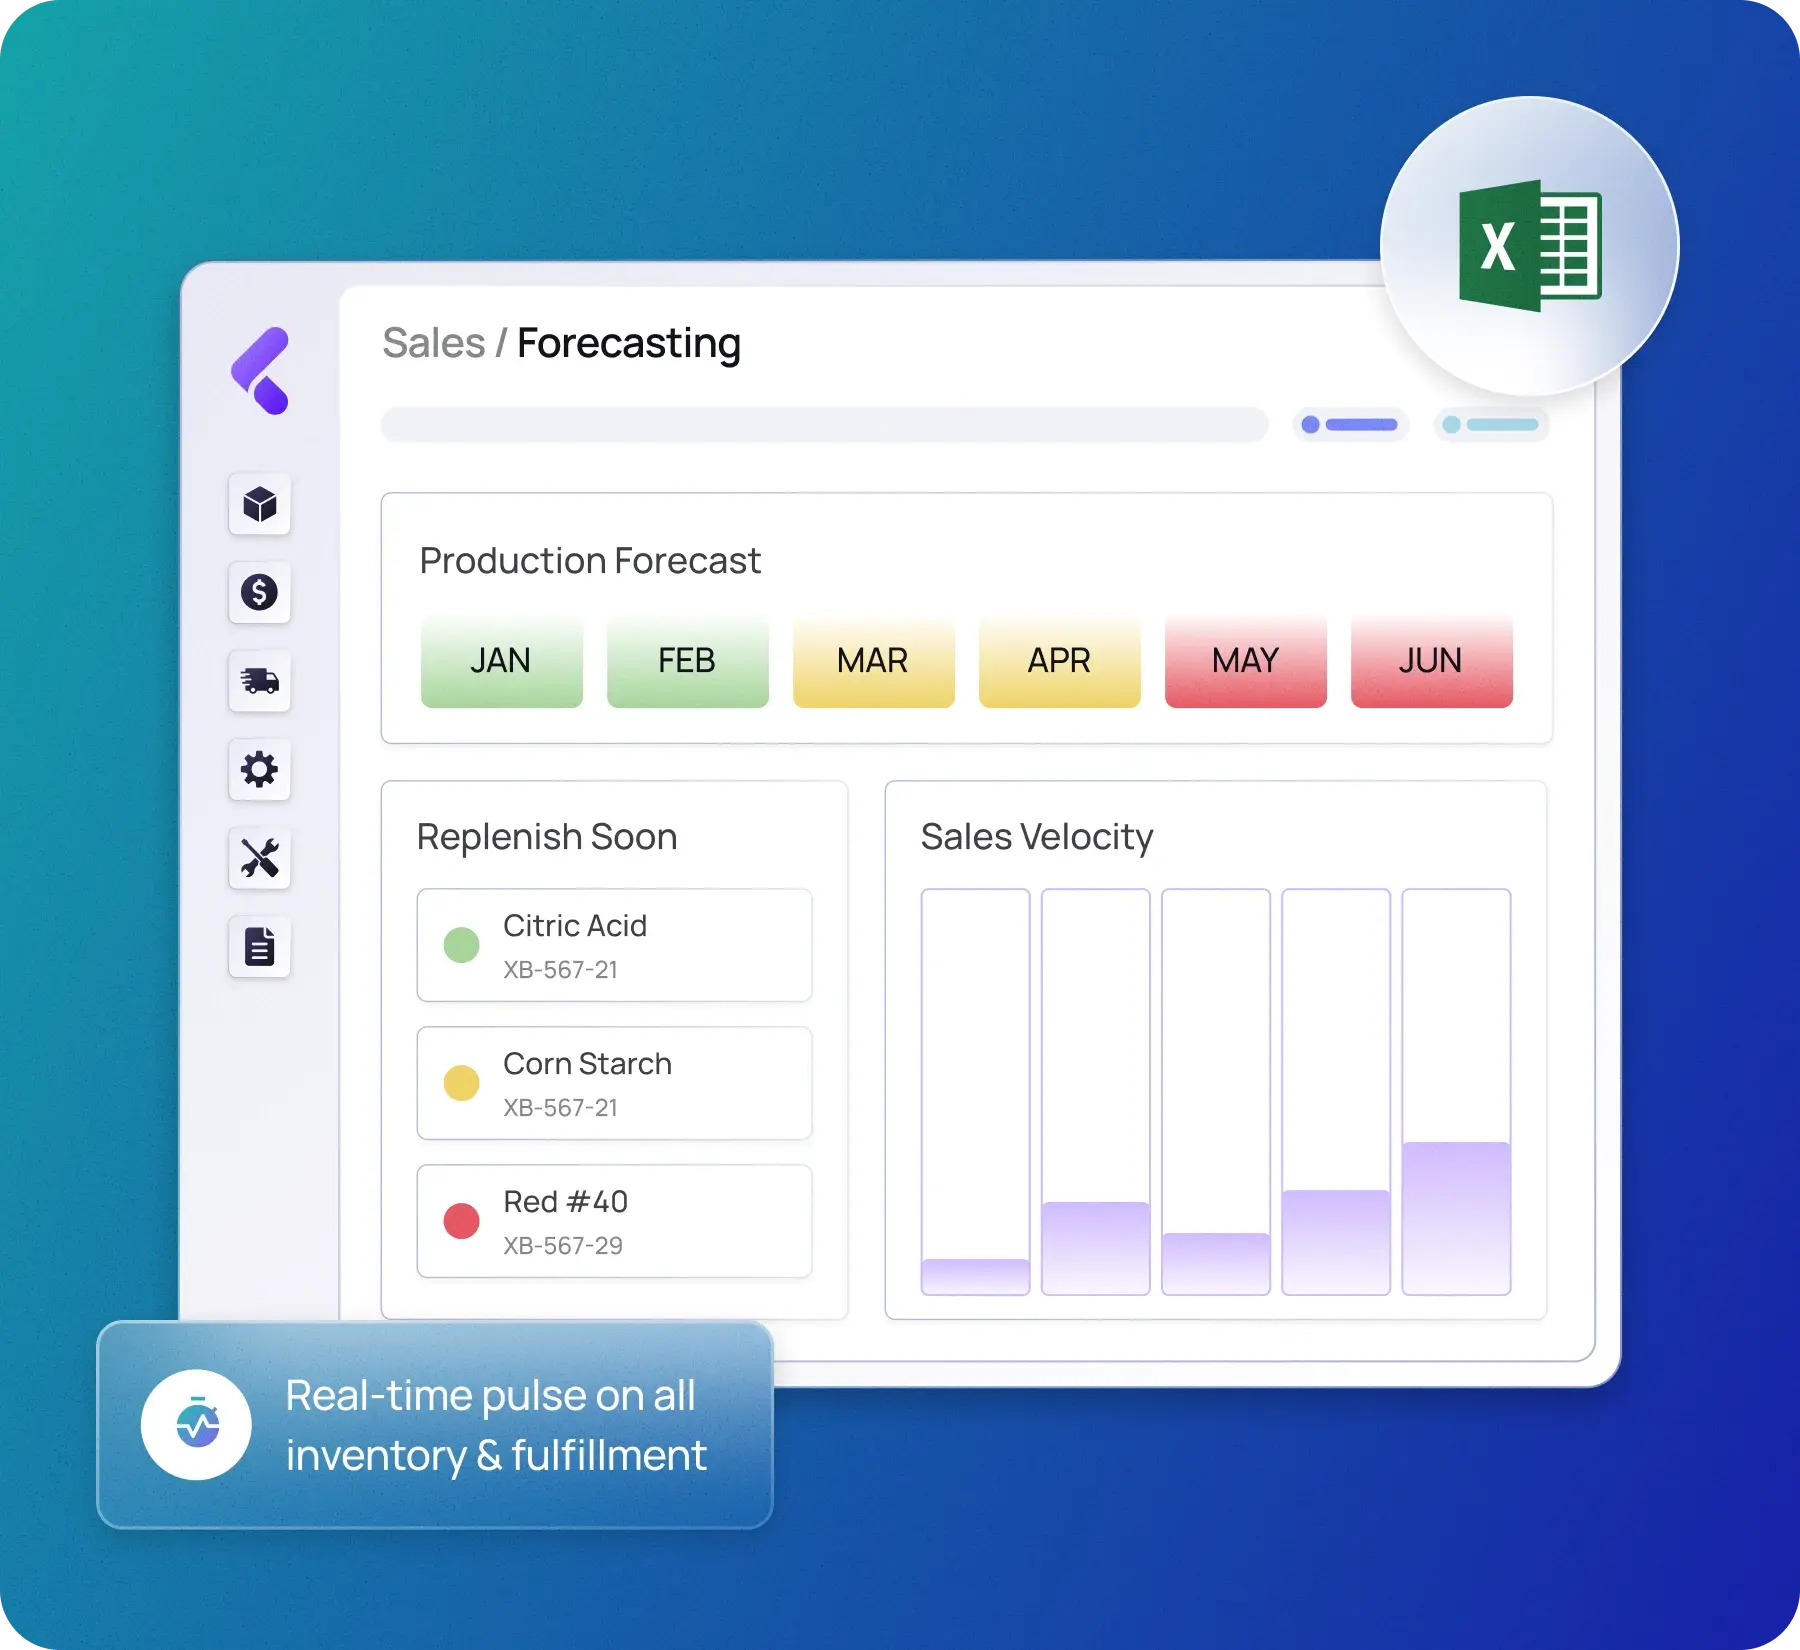
Auto-populating custom dashboards and reports
Every operator has a couple of Google Sheet reports they wish were automated. With Luminous, they are.
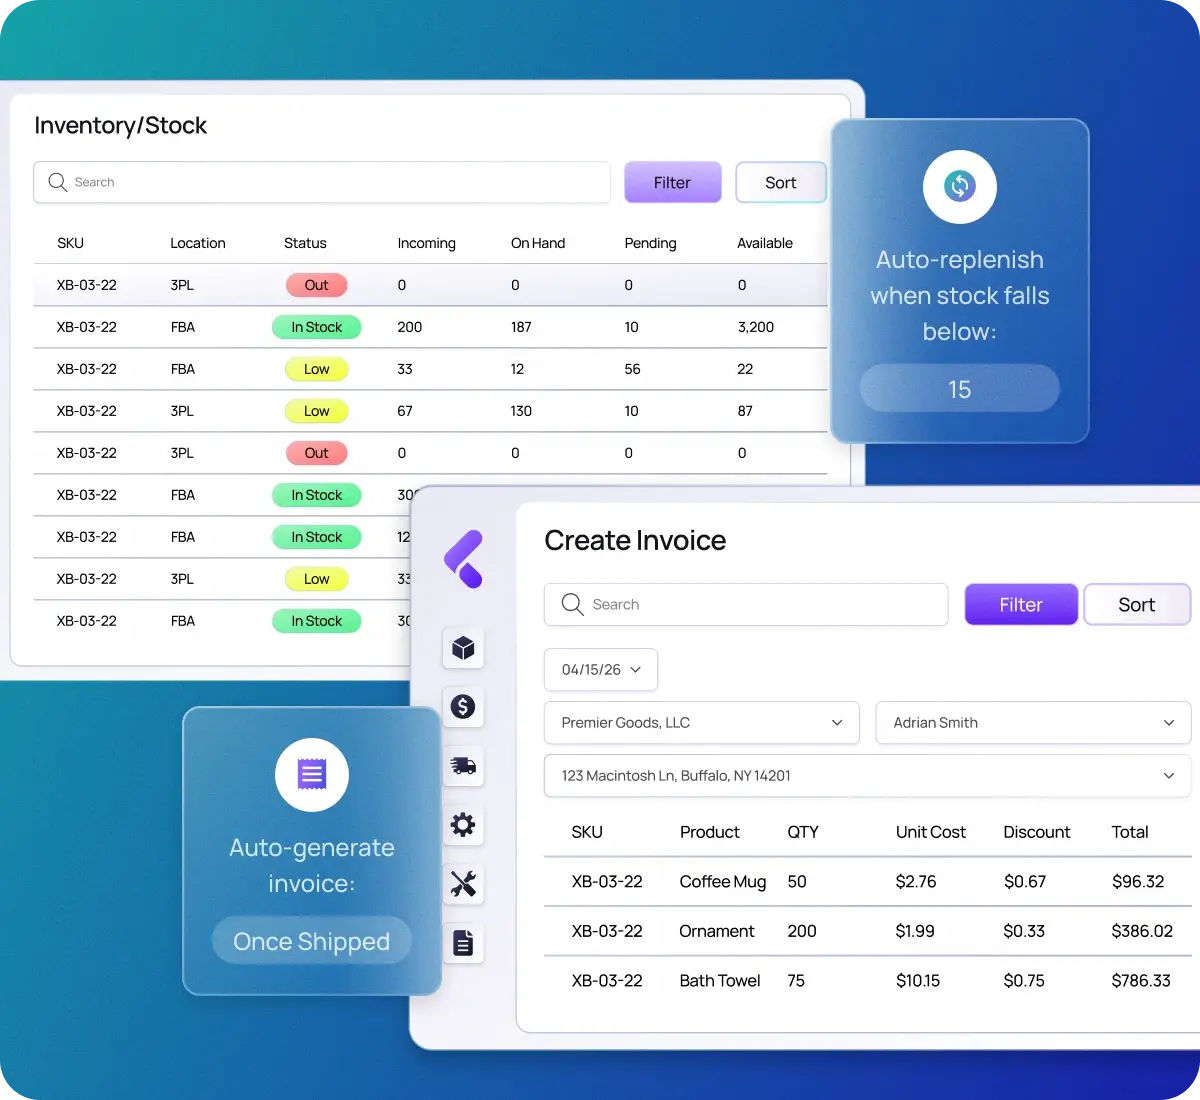
Get an instant visual representation of stock levels, sales, and channel performance.
Keep a real-time pulse on all inventory and fulfillment locations across your supply chain.
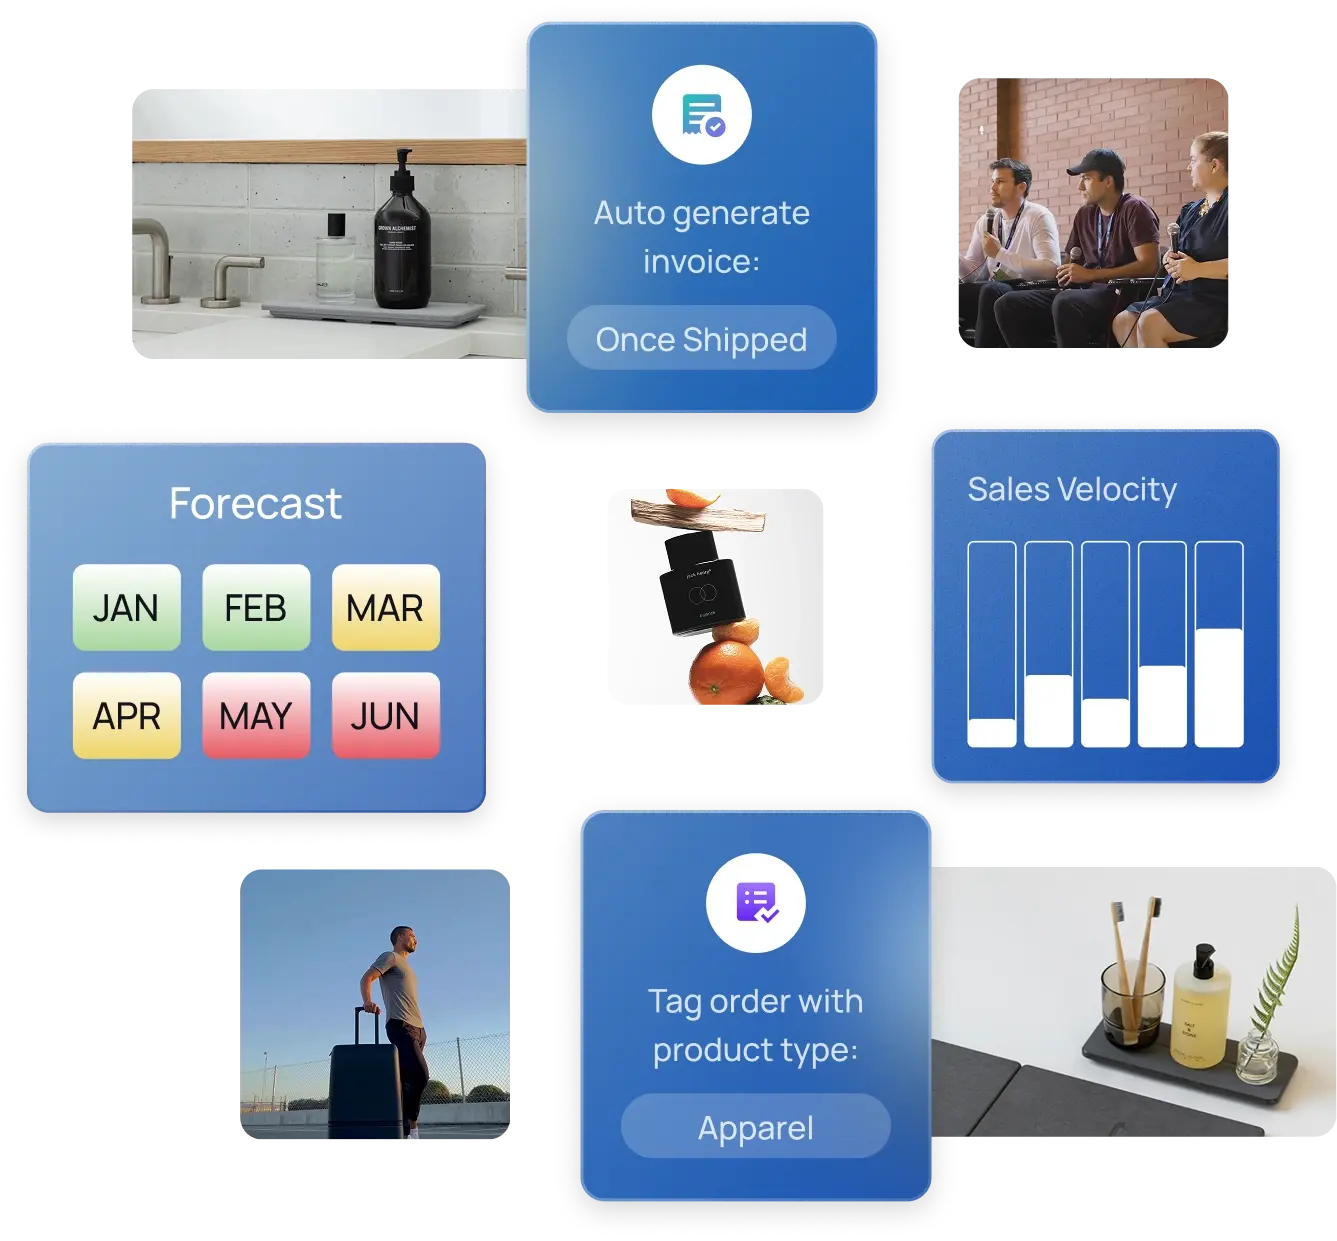
Automate the manual functions that slow your business down
Create automated functions and workflows between people and departments.
Use repeatable and predictable triggers to start an automated workflow.
Connect and automate purchasing, inventory, forecasting, and replenishment under one single source of truth.
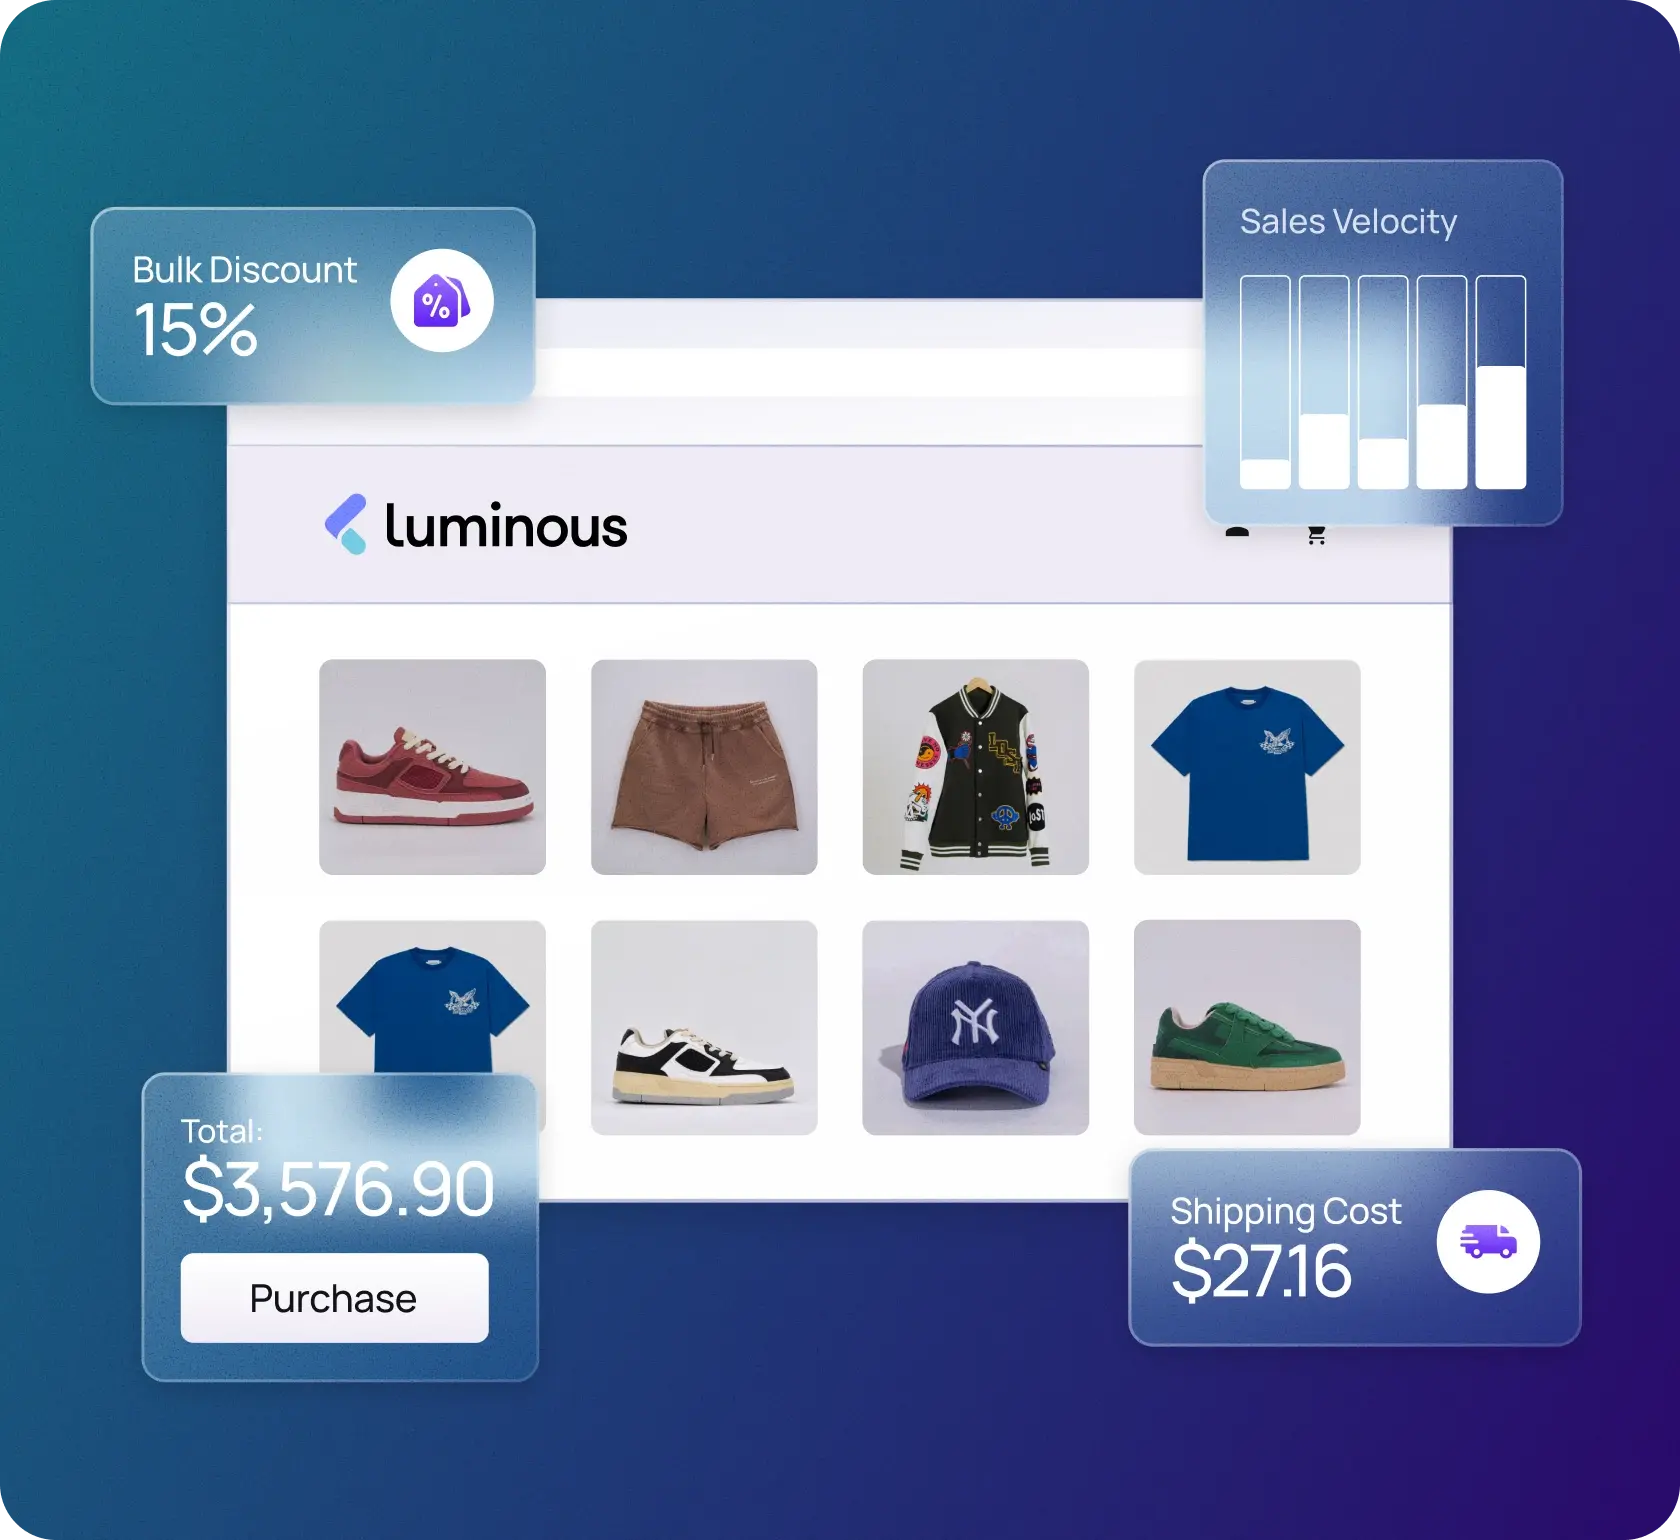
Make data-driven decisions to grow your business
Use real-time data to make faster and better decisions about how to run your business.
Prepare for high-volume sales events with comprehensive forecasting tools.
Understand customer behavior and trends to plan your stock levels months and years into the future.
Some questions, some answers
Here are our most frequently asked questions
As long as we are pulling in the field, we can put it onto a report. Reports generally mean tables, pivot tables, widgets, charts, graphs, etc. These are all things we can build to help you visualize.
You can built product catalogs that are assigned to individual customers or customer types. This lets you customize what they are able to see.